Azure Observability 101
This section should be a small cheatsheet about the observability landscape of Azure and what you need to know when you start creating resources for a solution. It will go over how your observability data is stored and the different visualization options.
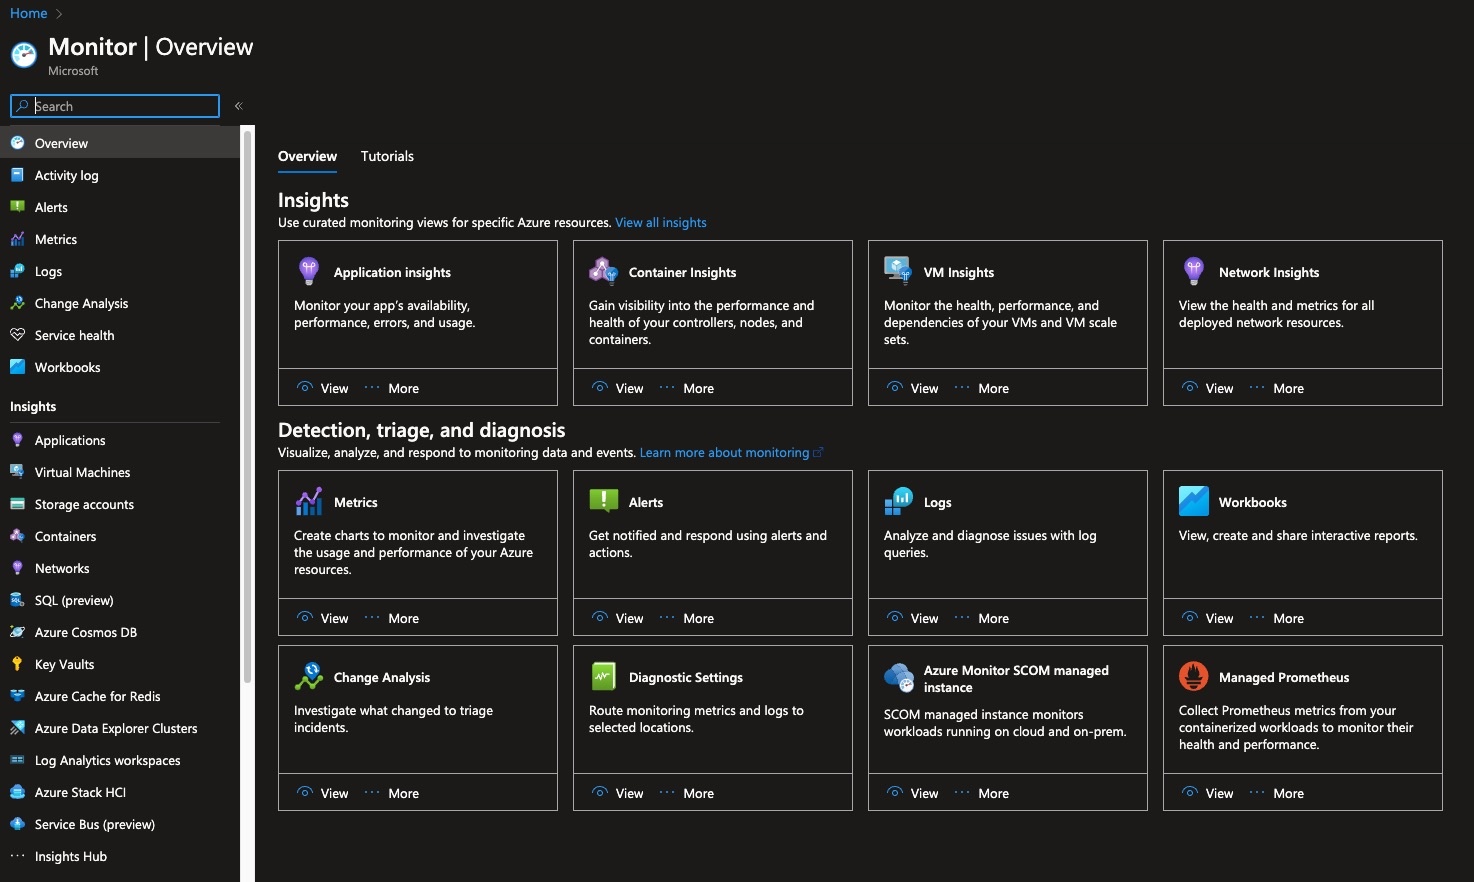
Azure Monitoring: Resources and Their Interplay
Lets have a look at the Azure Monitoring.
Let’s look at what normally happens when people need observability.
- Create Application Insights Resource.
- Pass the connection string of Application Insights to the application.
- And bam 💥! Automatically, you get your data in beautiful dashboards on Application Insights.
If this is enough for you, great! But often these dashboards don’t give you all the information about your application that you need. So, in case more complex dashboards, alerts are needed, or just out of pure curiosity, you want to know where you can find all the observability data. And spoiler, not all your data is stored in Application Insights!
Before we go further, it’s important to keep in mind that Azure handles some telemetry data differently. In particular, built-in metrics are handled differently than things like logs, traces, events, and even custom metrics.
But let’s first have a look at the whole group of logs, traces, events, custom metrics, etc. Our application sends data to Application Insights, but what then?
Azure Log Analytics Workspace
Note: If we refer to data in this section, we mean anything but built-in metrics (e.g., logs, traces, events, custom metrics, etc.). How built-in metrics are handled is described in the next section.
As mentioned, Application Insights does not have to store your data; but it is always in some form backed by a Log Analytics workspace. Now there are two modes in which you can set up your Application Insights.
- Classic
- Workspace-based
Classic
In this case, your Application Insights workspace is not directly backed by a workspace, and you have not configured your resource to be backed by a particular Log Analytics workspace; the data is stored by your individual resources or Application Insights itself. When you go to an existing resource, you will always see the tab Logs. That is a resource-internal Log Analytics workspace where the data is stored. As for the data you send Application Insights, they are stored in its own internal Log Analytics workspace.
This is easy and handy, as you don’t need a specific new resource. However, when you want to write queries or create dashboards that need data from more than one resource type, you run into some limitations.
Workspace-based
For the workspace-based approach, there is a central workspace. All resources and applications can send their data to that centralized place. The advantage there is that you can access data from multiple types of resources at the same time.
Azure Metric Workspace
Now when it comes to in-built metrics, the story is slightly different.
- Introduction to the new Metrics Workspace for Prometheus metrics.
Non-Internal Data and Incorporating Them into Azure
- Utilizing methods such as Data Collection Rule, Quota, etc., to bring external data into Azure.
Visualizations
- Exploring data sources for each visualization tool.
- Highlighting the pros and cons of each tool.
Dashboards
Workbooks
Third-Party Tools
e.g., Grafana 🚀