4. Custom metrics
🎯 Goal: Gain insights into how to add custom metrics to an application and visualize them in Application Insights.
⏩ Catch-up corner: If you missed previous sections 🏇
If you have not completed previous sections, follow these steps:
- Check out this branch
section/04-custom-metrics. - Copy the
.env.examplefile into a new file named.env, and update this new file with your values (ENV_PROJECT_NAMEmay contain only alpha numeric characters and must be between 5 and 50 characters). - Run
source .envto set environment variables. - Run the command
makefrom the root repository folder.
Custom metrics, also called user-defined or application-specific metrics, allow us to define and collect information about our system that the standard built-in metrics cannot track. This will typically be metrics related to the business logic of our application, allowing us to measure the impact of events happening in the system on the user experience or the business. In this section you will learn how to add custom metrics to our applications and find out how to visualize them in Application Insights. 🕵️♂️
📉 Adding custom metrics
Given our business logic, where devices periodically send temperature measurements, it would be useful to know how many device updates occurred in a specific time window. This will be our device update counter metric which we will define in the devices-state-manager application that handles all device state and temperature changes.
The basic observability instrumentation with OpenTelemetry gives us a good starting point to add custom metrics to our application in just a few minutes.
First, we need to add a new .NET package to the devices-state-manager application: System.Diagnostics.DiagnosticSource.
In the application code, we need to create an instance of the Meter class, which will be responsible for creating and tracking metrics.
🔦 Code snipped on how to create a meter.
using System.Diagnostics.Metrics;

namespace DevicesStateManager
{
    class EventHubReceiverService: IHostedService
    {
        private readonly Meter _meter;

        public EventHubReceiverService()
        {
            // Set up other dependencies
            // ...
            _meter = new Meter("DevicesStateManager");
        }
    }
}
Now let’s define our custom metric. It will track processed device state updates, so let’s give it a meaningful name and description. We will use the Counter class which is useful for tracking a total number of requests, events, etc.
🔦 Code snipped on how to define the metric.
    _deviceUpdateCounter = _meter.CreateCounter<int>(
        "device-updates", description: "Number of successful device state updates");
🧮 Counter
Now that we have our metric defined, let’s start tracking device updates. Try to add code that increments the counter every time a device temperature and state is updated successfully. You can optionally set tags on the counter update; try to add a tag containing the device ID.
🔦 Code snipped on how to increment the counter.
private async Task<HttpResponseMessage?> UpdateDeviceData(DeviceMessage deviceMessage)
{
    // Process the device update
    // ...
    if (response.IsSuccessStatusCode)
    {
        // ...
        _deviceUpdateCounter.Add(1, new KeyValuePair<string, object?>("deviceId", deviceMessage.deviceId));
    }
    else
    {
        _logger.LogWarning($"Request failed with status code {response.StatusCode}");
    }
}
Well done! You defined the first custom metric for our application. 🎉
📝 Note: It would be useful to also track failed device updates. Try to add another metric to collect these events.
📊 Histogram
So far we only used a Counter instrument, but there are more instrument types available. Check out the documentation to learn more about them.
Tracking temperature values reported by devices will be another useful application of custom metrics in our use case. Let’s use the Histogram instrument type which will allow us to visualize the distribution of temperature measurements. Try to add this new metric to the application code.
🔦 Code snipped on how to add the histogram.
class EventHubReceiverService: IHostedService
{
    private readonly Meter _meter;
    private readonly Counter<int> _deviceUpdateCounter;
    private readonly Histogram<float> _temperatureHistogram;

    public EventHubReceiverService()
    {
        _meter = new Meter("DevicesStateManager");
        _deviceUpdateCounter = _meter.CreateCounter<int>("device-updates", description: "Number of successful device state updates");
        _temperatureHistogram = _meter.CreateHistogram<float>("temperature", description: "Temperature measurements");
    }

    private async Task<HttpResponseMessage?> UpdateDeviceData(DeviceMessage deviceMessage)
    {
        // Process the device update
        // ...
        if (response.IsSuccessStatusCode)
        {
            _deviceUpdateCounter.Add(1, new KeyValuePair<string, object?>("deviceId", deviceMessage.deviceId));
            _temperatureHistogram.Record(deviceMessage.temp);
        }
        else
        {
            _logger.LogWarning($"Request failed with status code {response.StatusCode}");
        }
        return response;
    }
}
🐳 Configure Deployment to Export Custom Metrics
Finally, we need to register our Meter with the previously added OpenTelemetry instrumentation, by setting an additional environment variable for the devices-state-manager container. Set the OTEL_DOTNET_AUTO_METRICS_ADDITIONAL_SOURCES environment variable with value matching the name of the Meter you previously created. You can do this by adding the variable to the k8s deployment manifest of devices-state-manager.
🔦 Click here to see the snippet of the k8s deployment manifest.
- name: OTEL_DOTNET_AUTO_METRICS_ADDITIONAL_SOURCES
  value: "<meter-name>"
Redeploy the devices-state-manager and wait until there are a few device temperature updates.
🔍 Hints: You can use these commands from the root of the repository to redeploy the application.
make push
make deploy
👀 Find your custom metrics
Now that we defined our custom metrics, let’s find them in the Azure Portal and see the fruits of our work!
Go to Application Insights and select the Metrics section. You can find your custom metric called device-updates as both a log-based and custom metric.
Select the device-updates metric and adjust the aggregation and time span and see how the generated graph changes.
Click here to see the graph showing device updates 📈
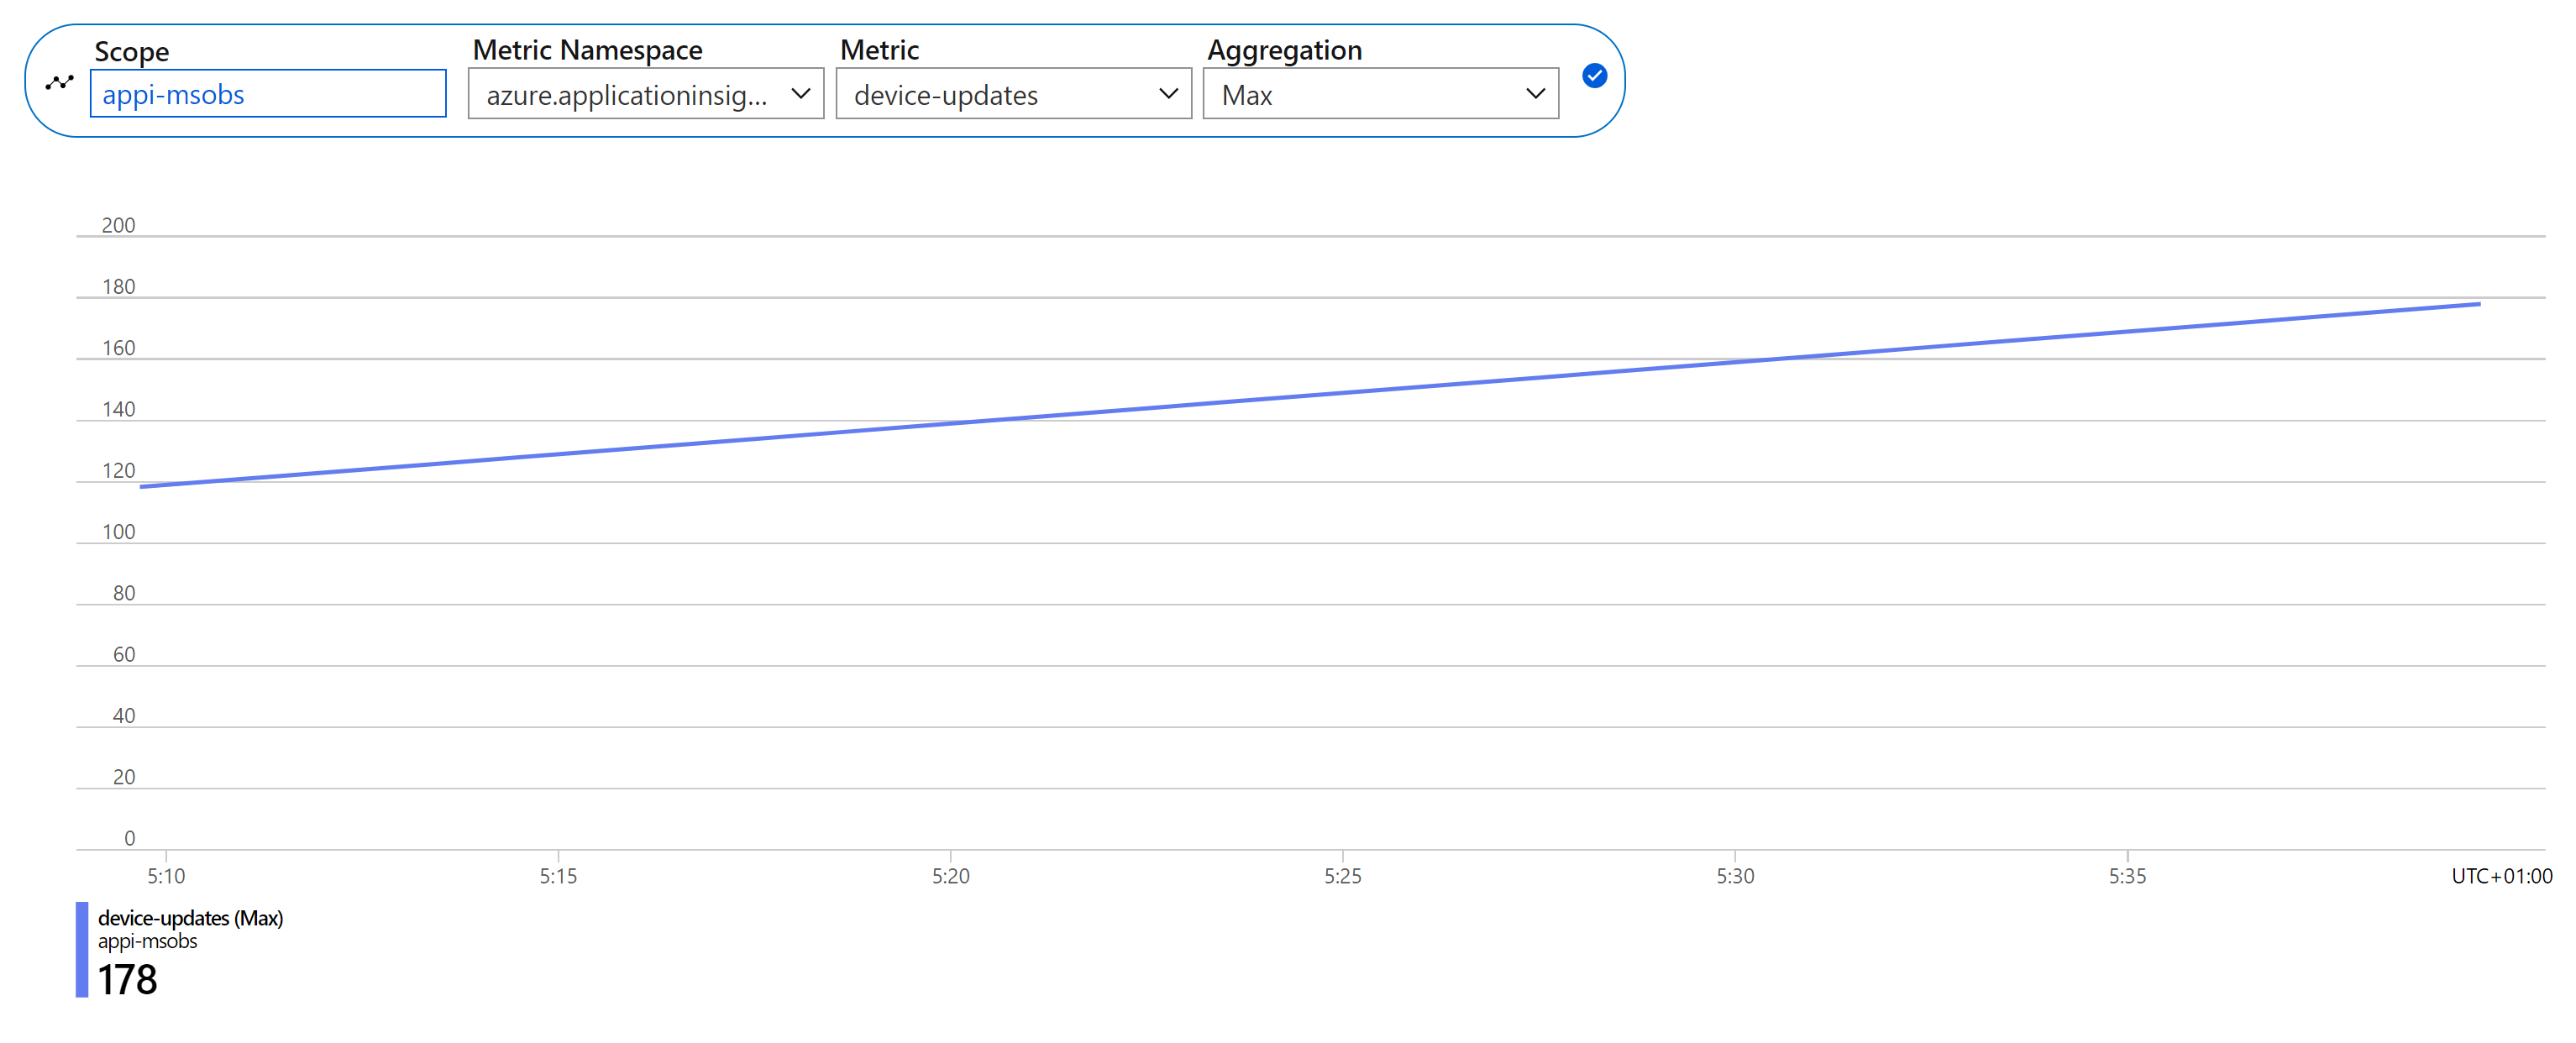
Remember how we added tags to our metrics, when we created them?
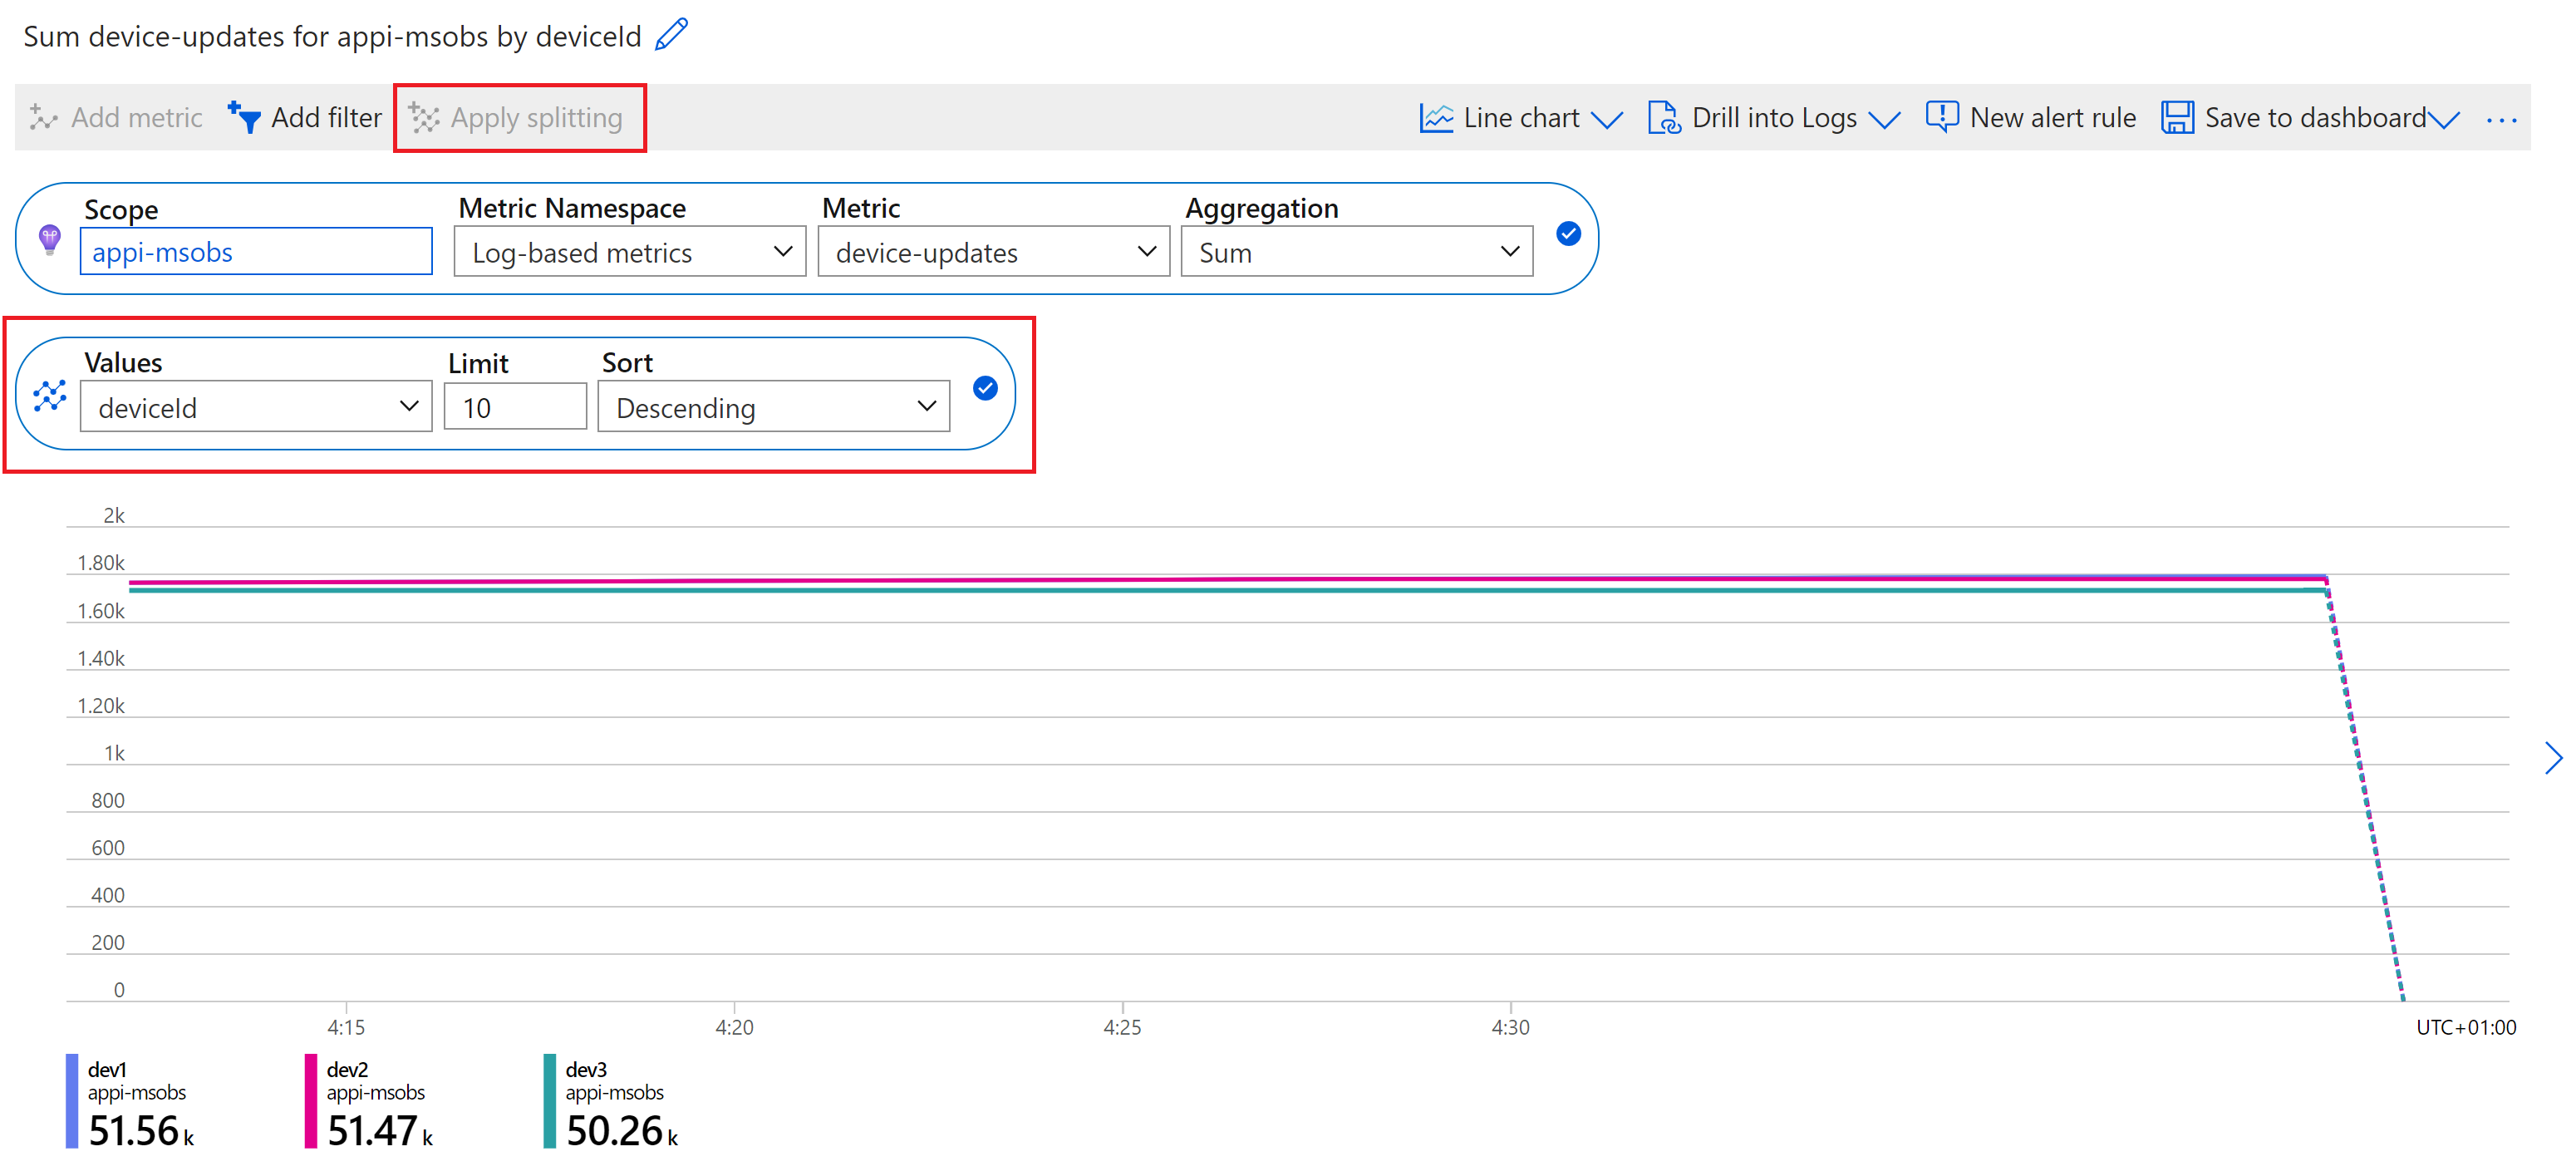
The graph created above is useful, but using our tags we could now go as far as to create a chart showing updates per device. We can do this by splitting the metric by deviceId. Select the device-updates metric in the Log-based metrics Namespace and then select the Apply splitting option to generate separate graphs for each device.
Click here to see the device update chart split by device ID 📠
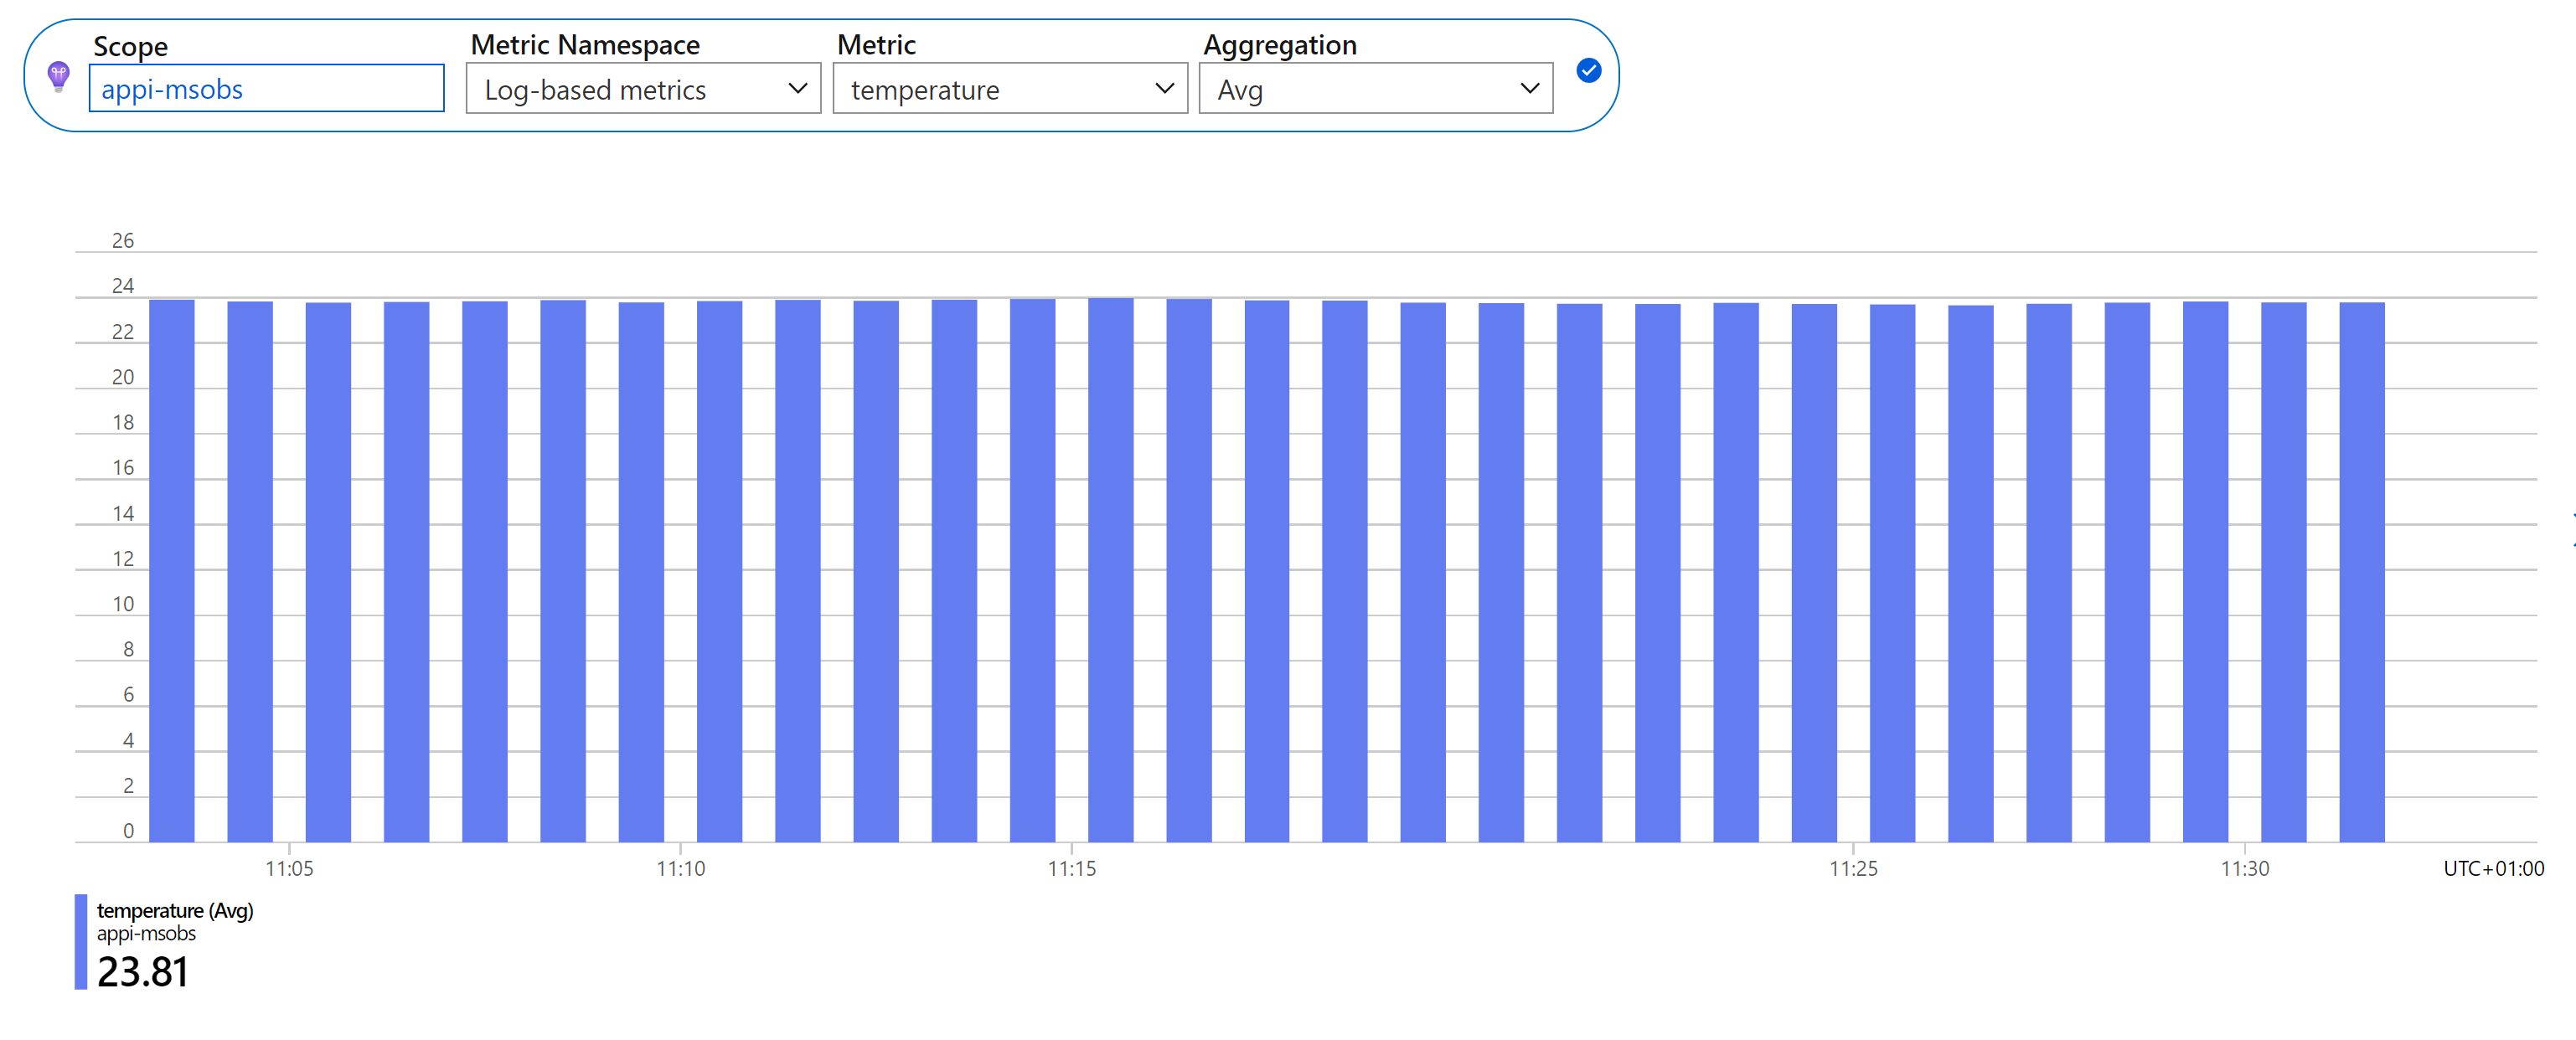
Now, let’s go and have a look at the second custom metric we created, which tracks the reported temperature values. Select the temperature metric, adjust the aggregation to Min, Max or Avg and change the graph type to Bar chart. We can now see the distribution of temperature measurements sent by our devices.
Click here to see the temperature chart 🌡️
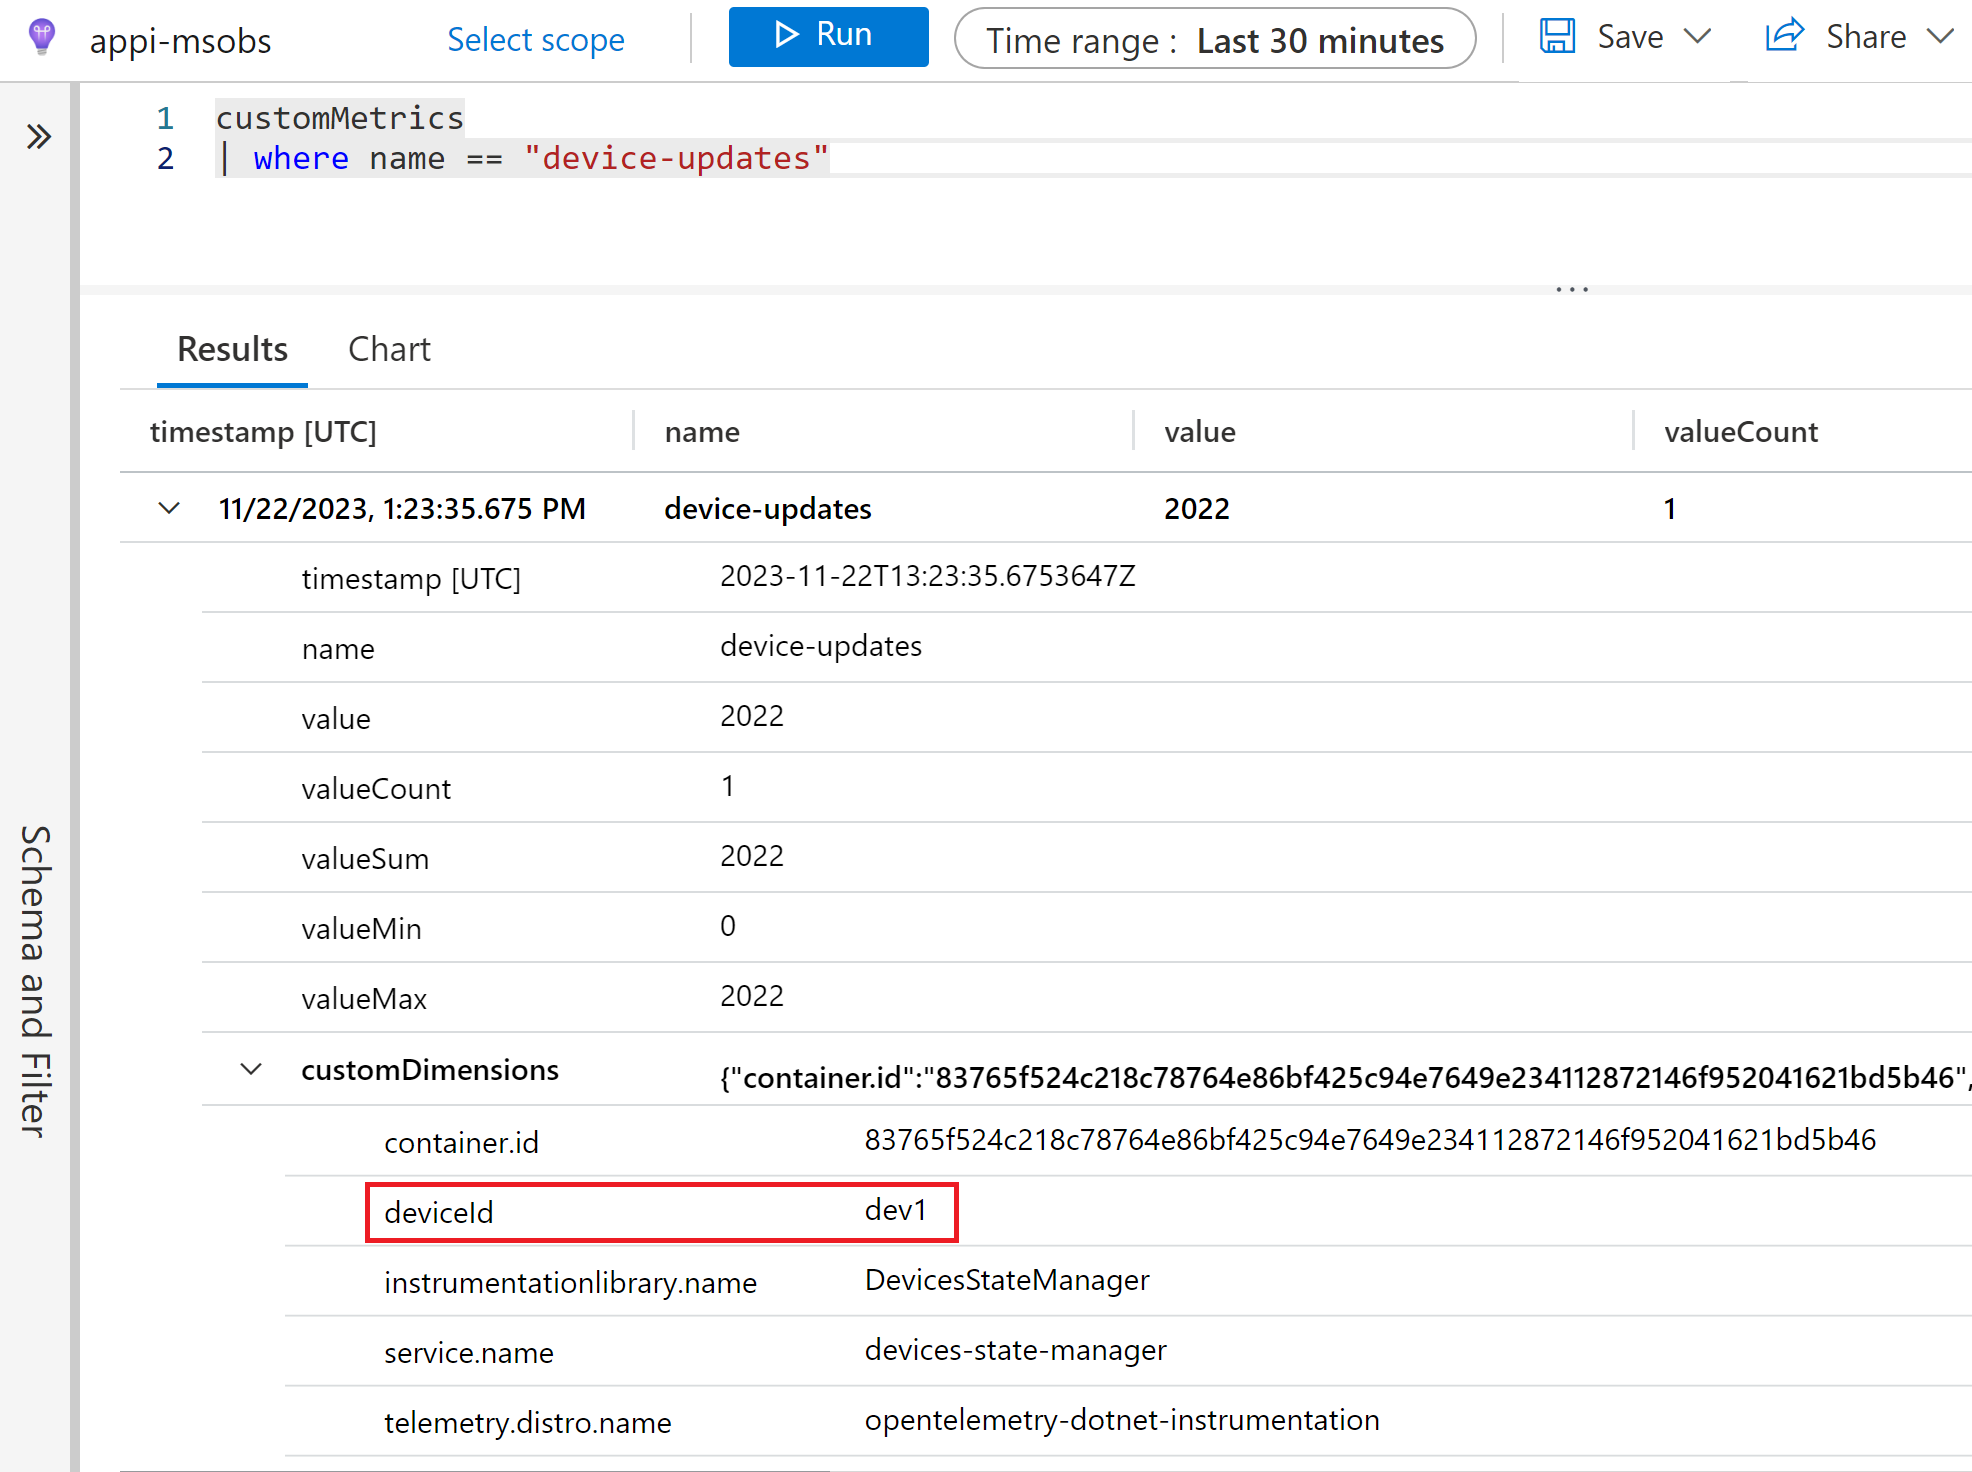
You can also query your custom metrics like all the other logs. For this, go to the Logs section of the portal and query the customMetrics table to see more details of your custom metrics.
Just as an example, looking at the device-updates metric entries, can you find the device ID which you previously used to tag the metric updates?
🔦 Click here to see the custom metric in the Logs section and the device ID tag📔
In this section we added custom metrics to our .NET application and learned how to visualize them in Application Insights. OpenTelemetry allows you to add similar metrics to applications written in other languages. Although we won’t go into the details here, this page provides useful details on how you can add custom metrics to our Java application. 🔎
To learn about other features of the metrics view, as well as how to create and add these generated graphs into a custom dashboard, follow the next few chapters 😉.
Navigation
Previous Section ⏪ ‖ Return to Main Index 🏠 ‖ Next Section ⏩️